
At JAS Farm, we believe good agronomic decisions should be backed by field results and sound economics. A product or practice might increase yield, but the bigger question is whether that improvement pays for itself.
That’s why we put different soybean treatments to the test in our 2026 soybean plot. We evaluated plant populations and fertility inputs, harvested each treatment, and analyzed the results to look beyond yield alone.
Our goal is simple: give growers useful, real-world information they can use when making decisions for their own operations.
The 2026 soybean plot
Our plot featured Pioneer 35Z76E soybeans, planted May 19 and harvested October 14, 2026. We evaluated several fertility treatments alongside different soybean planting populations.
The treatments included:
An untreated fertility control
Syntose FA applied in-furrow
3-18-18 fertilizer
A combination of Syntose FA and 3-18-18
Plant populations ranging from 110,000 to 160,000 seeds per acre
Each treatment was harvested and weighed individually. Because harvested grain moisture varied among treatments, we adjusted the recorded weights to a common 13% moisture basis before comparing yields.
This allows us to make a more consistent comparison between treatments rather than letting differences in grain moisture influence the reported yield.
What did the yield results show?
The moisture-adjusted results showed differences among the treatments.
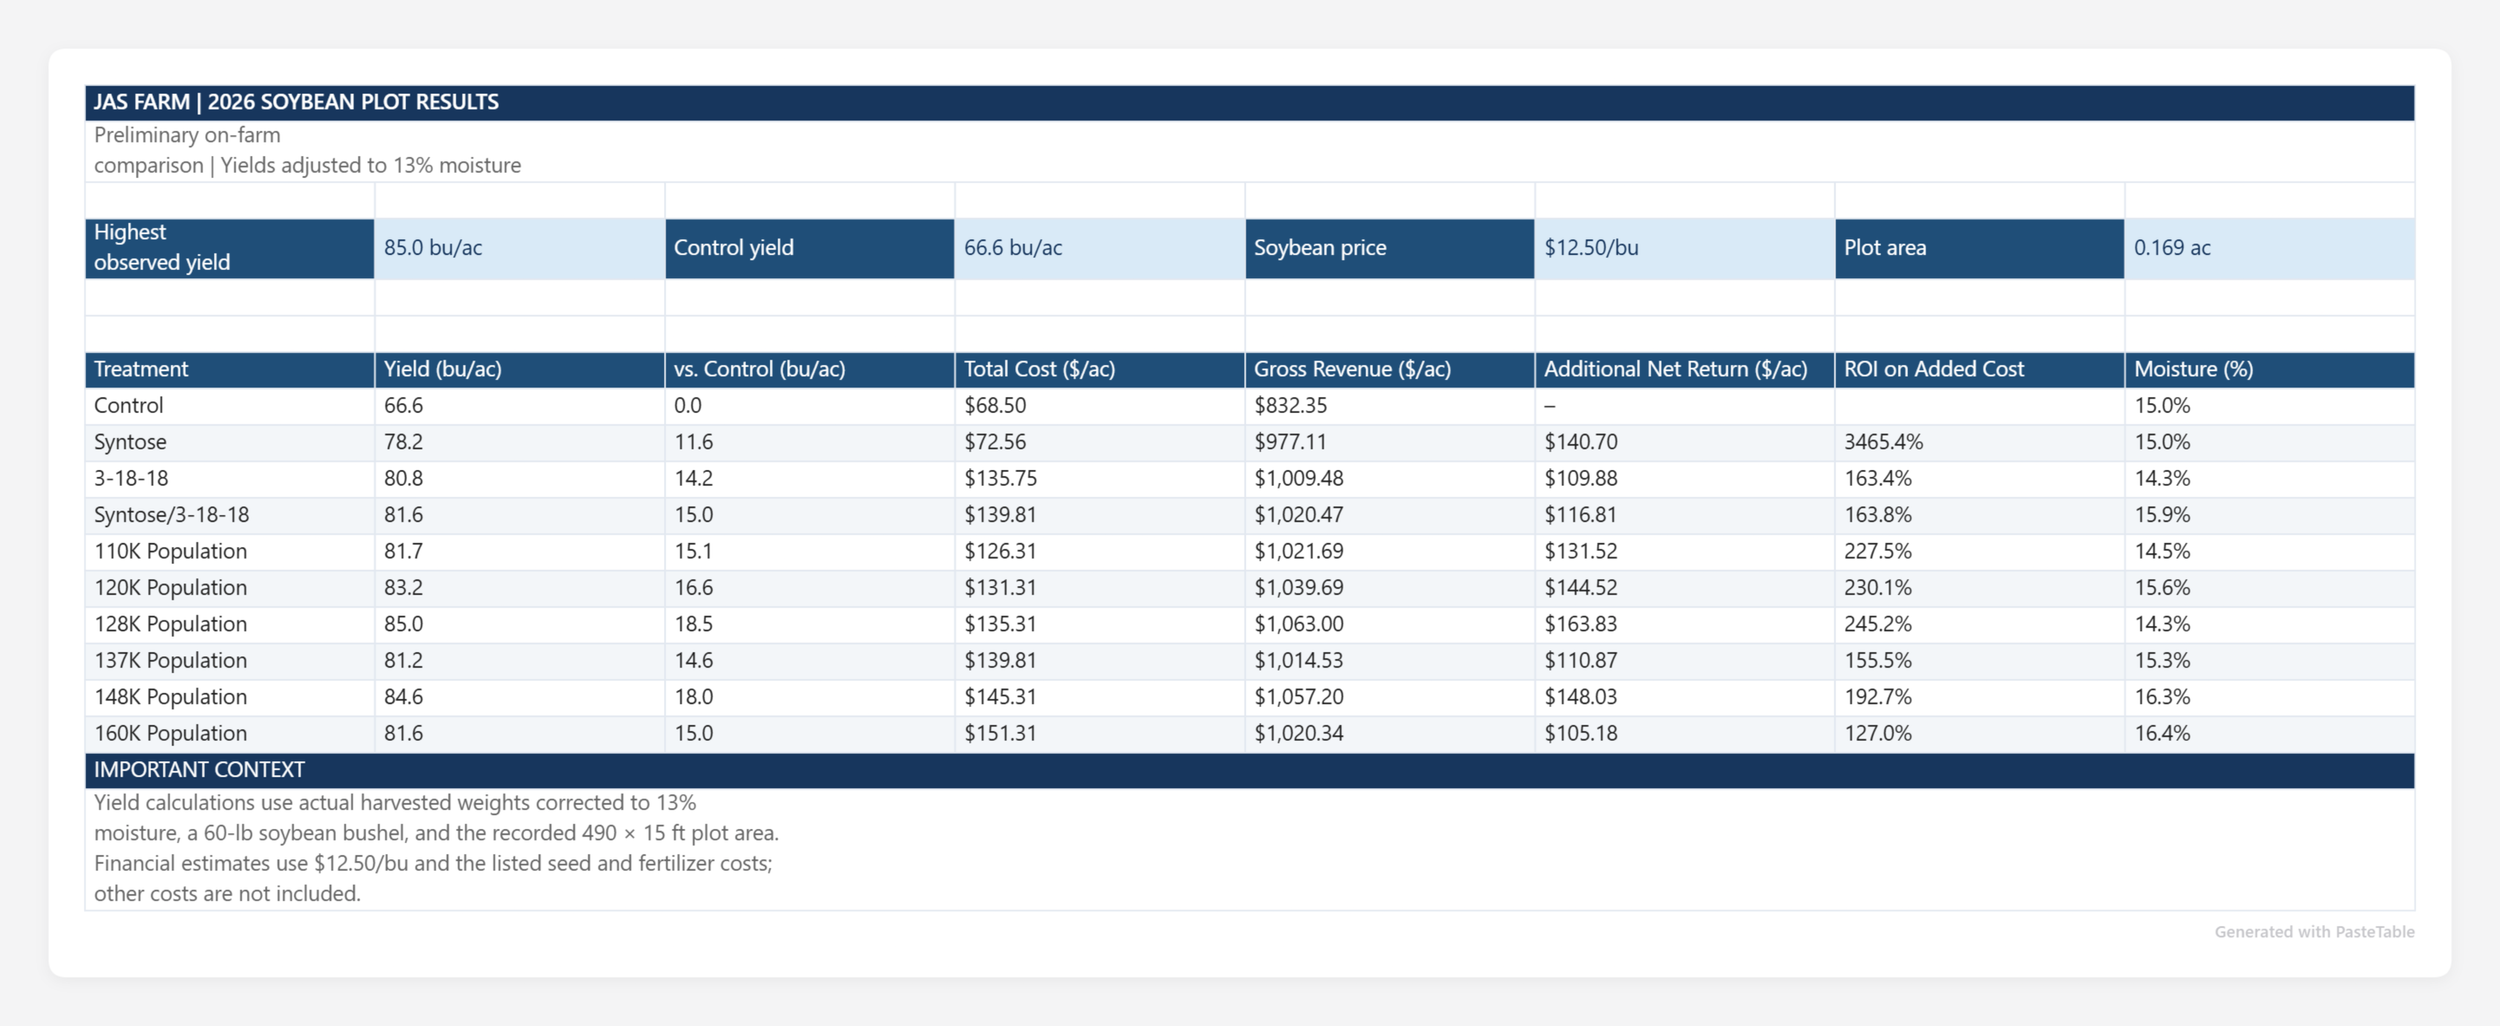
Treatment Adjusted yield (bu/ac) Control 66.59 Syntose 78.17 3-18-18 80.76 Syntose + 3-18-18 81.64 110K population 81.74 120K population 83.17 128K population 85.04 137K population 81.16 148K population 84.58 160K population 81.63
The 128,000-seed population produced the highest measured yield in this plot at approximately 85.04 bushels per acre. The 148,000-seed population was next at 84.58 bushels per acre.
However, the highest yield does not automatically mean the best economic outcome. Seed costs change with planting population, and additional inputs must earn their place in the budget.
Population is an economic decision, too
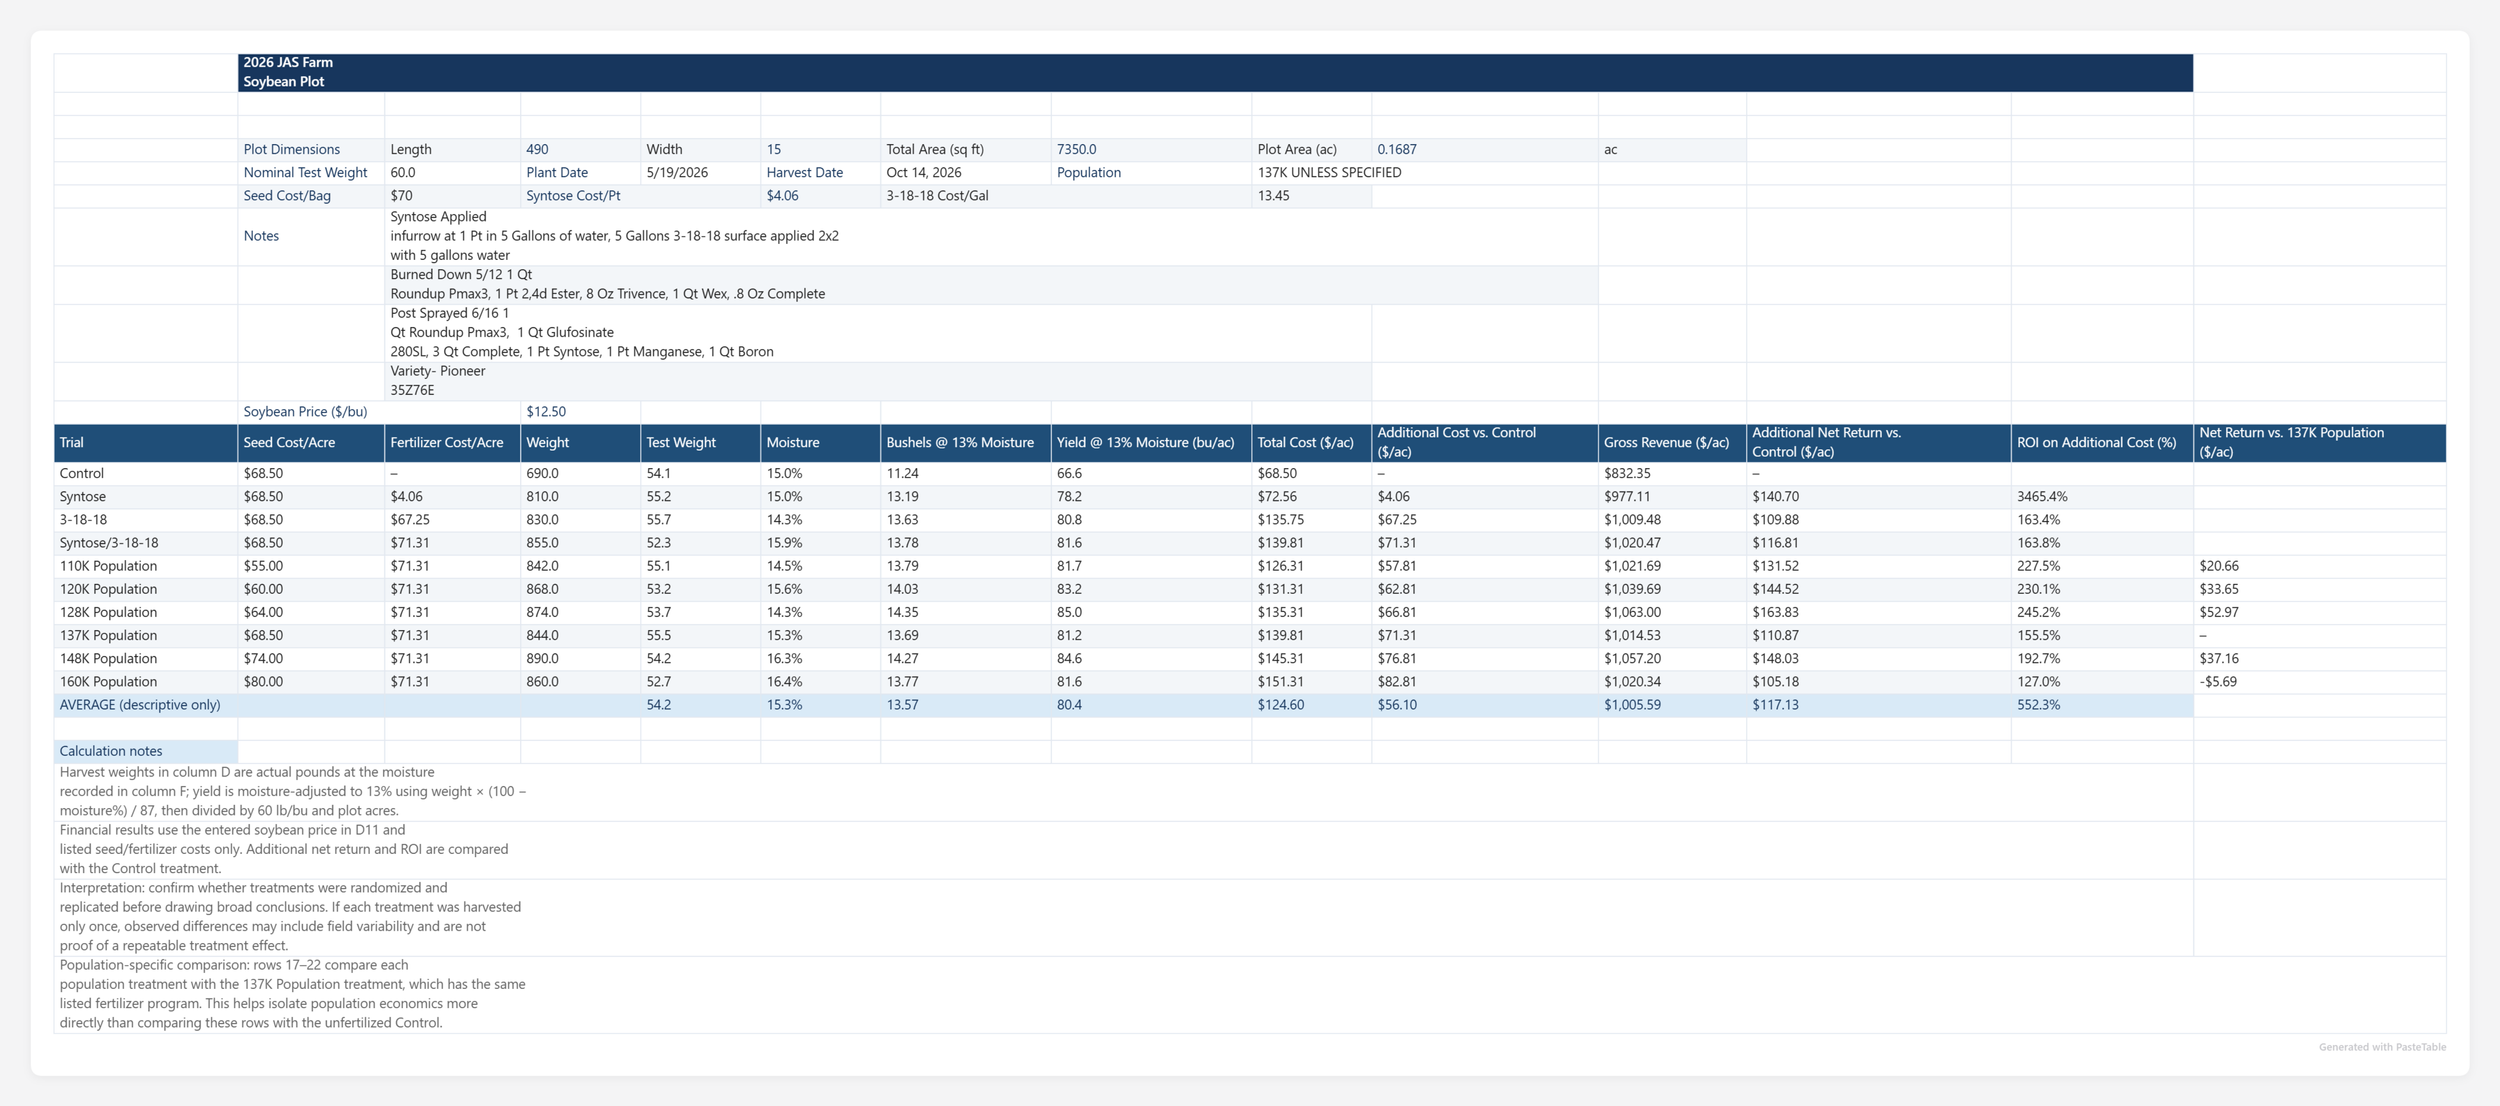
To examine the economics of planting population, we compared the population treatments against the 137,000-seed treatment. This is a more useful comparison because all of these population treatments had the same listed fertilizer cost of $71.31 per acre.
For this analysis, we used a soybean price of $12.50 per bushel, the price recorded on the day of harvest, along with the listed seed and fertilizer costs.
Population Yield (bu/ac) Estimated return difference vs. 137K
110K 81.74 +$20.66/ac 120K 83.17 +$33.65/ac 128K 85.04 +$52.97/ac 137K 81.16 Reference 148K 84.58 +$37.16/ac 160K 81.63 −$5.69/ac
These are estimated differences in return after accounting for the listed seed and fertilizer costs. They do not include application costs or other production expenses that may vary.
Why the 128K treatment stands out
The 128,000-seed treatment yielded approximately 3.88 bushels per acre more than the 137,000-seed treatment.
At $12.50 per bushel, that yield difference represents about $48.47 per acre in additional grain revenue. The 128K treatment also had a listed seed cost $4.50 per acre lower than the 137K treatment.
Together, those differences produce an estimated $52.97 per acre advantage over the 137K treatment under the assumptions used in this analysis.
At the other end of the comparison, the 160K treatment yielded only about 0.46 bushel per acre more than the 137K treatment, while its seed cost was $11.50 per acre higher. Under these assumptions, the additional grain revenue did not cover the added seed cost.
This is why we believe planting population should be evaluated using both yield and economics. More seed does not necessarily mean more profit.
What about the fertility treatments?
The fertility portion of the plot also produced differences worth examining. The Syntose treatment yielded 78.17 bushels per acre, while the 3-18-18 treatment yielded 80.76 bushels per acre. The combined treatment yielded 81.64 bushels per acre.
These results provide a useful starting point for evaluating the treatments under our field conditions. The economic comparison, however, needs to account for each treatment's input cost. The 3-18-18 and combined treatments carried higher listed fertilizer costs than the control, so additional yield must be considered alongside those costs.
A single on-farm result should not be treated as proof that a product will deliver the same response in every field. Soil conditions, weather, fertility levels, management, and other factors can influence how a treatment performs.
Our takeaway: measure what matters
At JAS Farm, we want to do more than report which treatment yielded the most. We want to understand what those results mean for a grower's bottom line.
Our 2026 plot reinforces an important principle: the best agronomic decision is not always the one that produces the highest yield. It is the one that delivers a sound return for the dollars invested.
We will continue evaluating products and practices in our own fields, measuring the results, and sharing what we learn. We believe that transparent, locally generated data can help growers ask better questions and make more informed decisions.
These results represent one on-farm plot and one growing season. The available worksheet does not document replication or statistical analysis, so yield differences should be viewed as observations from this trial rather than statistically proven treatment effects.
Want to talk through the numbers?
Contact JAS Farm to discuss the trial, our crop nutrition products, or how we approach agronomic decisions on the farm. Our goal is to put farmers first by combining field experience, practical agronomy, and an honest look at the economics.
Farmers First